

FLOW CYTOMETRY PANEL DESIGN
Validation of flow cytometry multicolor panels are critical for accurate assessment of treatment impact on cell subsets of the blood, tissue, or tumor microenvironment. Factors such as sample collection and preparation, fixation and permeabilization reagents, and staining technique can influence the accuracy and precision of study data. As a result, even off the shelf flow cytometry panels from reputable vendors should be validated for use in your specific study protocol. Once the multicolor panel design is completed, data can be represented and visualized in t-SNE plots to view how specific cell subset organize.
antibody validations
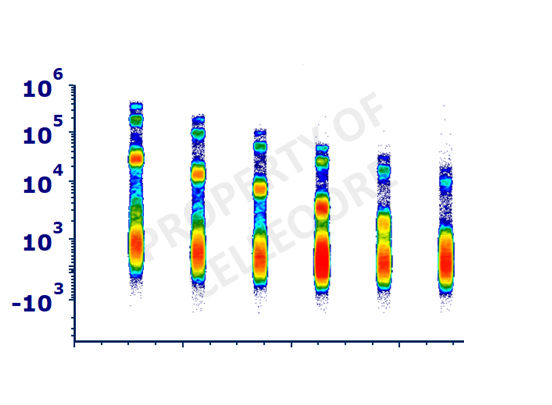
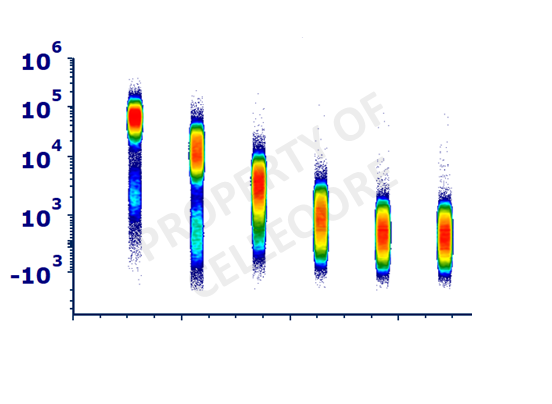
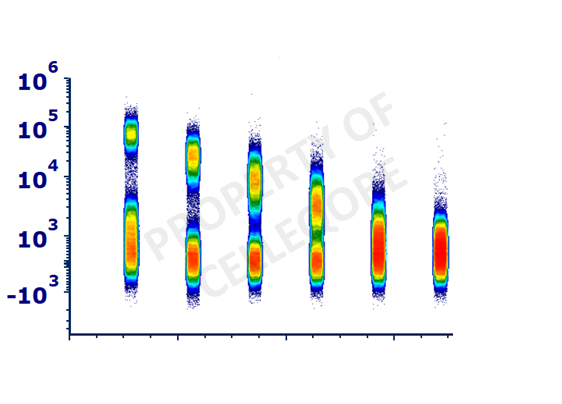
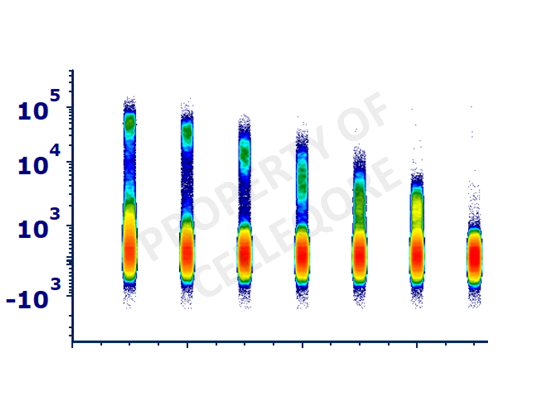
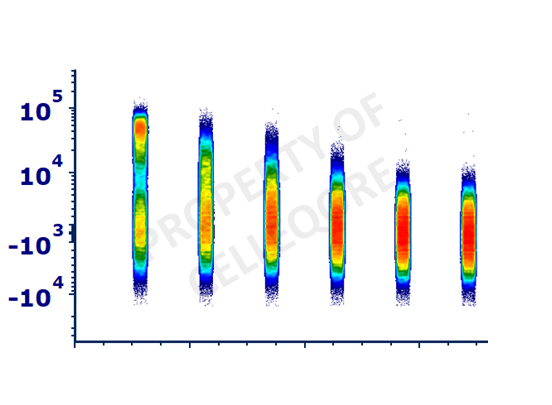
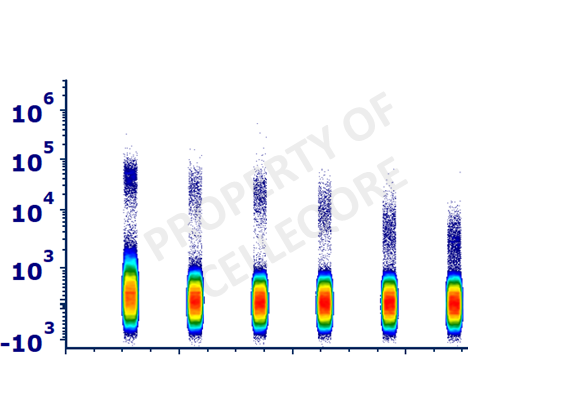
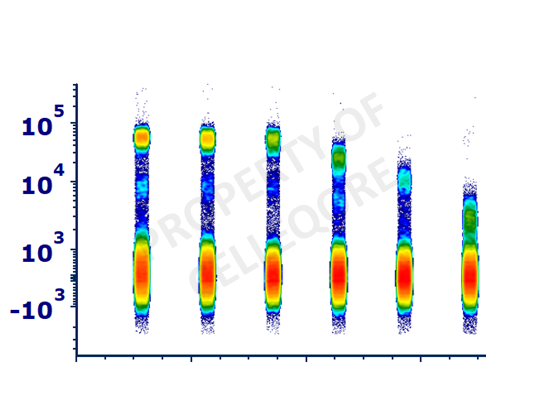
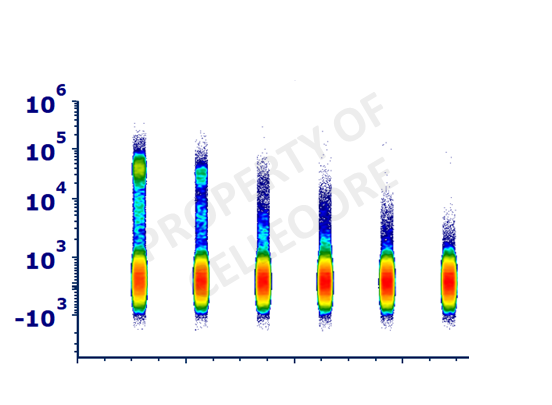
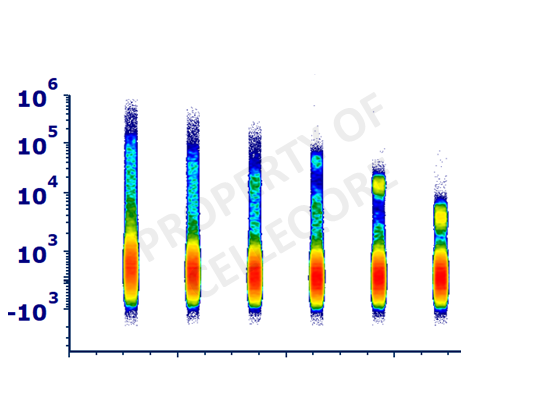
Shown below are dilutions of antibodies illustrating the resolution of positive and negative populations. This is a portion of the multicolor panel design validation to assess antibody and fluorophore performance for each marker. Celleqore develops and validates custom or non-flow antibodies using additional techniques prior to utilization within the flow cytometry panel.

viability
cD45
cD3
cD8
cD4
cD19
cD20

cD56

cD33
cD11c
CD11b
CD14

CD15

CD16

Custom

Flow cytometry data analysis services
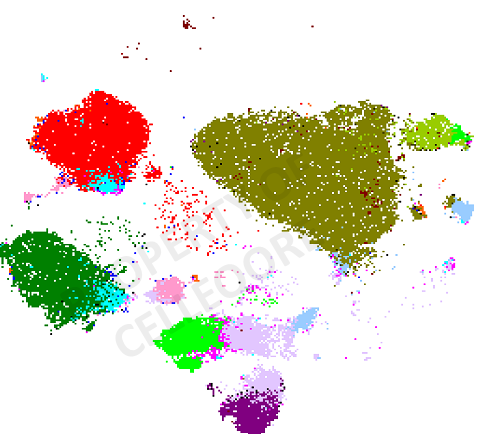
HEALTHY DONOR (HD) OR PATIENT REPRESENTED IN t-SNE PLOTS
Each color in the t-SNE plot represents a specific cell subset. Briefly, the major subsets listed are CD4 T cells (red), CD8 T cells (green), B cells (purple), classical monocytes (olive green), non-classical monocytes (light green), intermediate monocytes (yellow green), and CD33+ non-monocytes (sky blue).
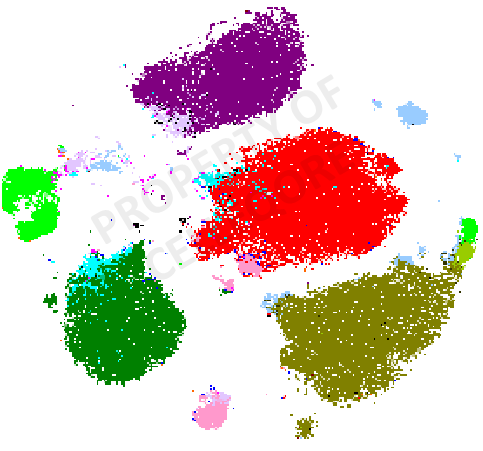
healthy donor
Distribution showing higher B cell frequencies compared to other healthy donors
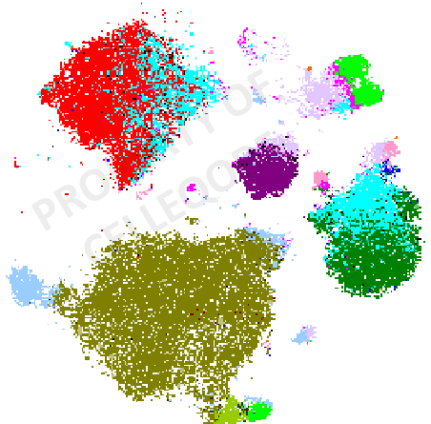
healthy donor
Distribution showing wide separation between T cells compared to other healthy donors
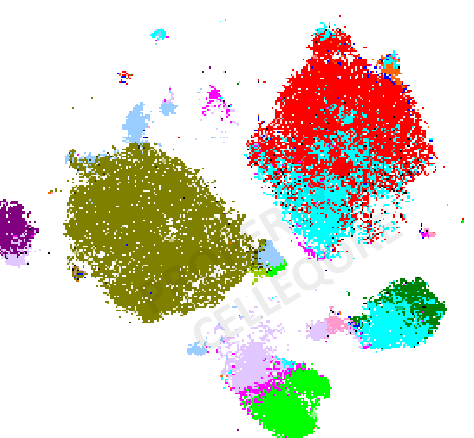
Healthy Donor
Distribution showing lower CD8 T cell frequencies compared to other healthy donors
Patient Sample
Distribution showing lower T cell frequencies compared to healthy donors
target antigen evaluation by flow cytometry
Antigen Expression levels in PBMCs REPRESENTED IN t-SNE PLOTS
Immune cell subsets (left) and expression level of the marker of interest (right) for a representative patient sample shown in a t-SNE plot. Within the monocyte group, the distribution of cells shows higher expressing monocytes (yellow-red) grouped separately from lower expressing monocytes (dark blue).
PBMC distribution in Patient sample
Immune cell subsets: CD4 T cells (red), CD8 T cells (green), B cells (purple), classical monocytes (olive green), non-classical monocytes (light green), intermediate monocytes (yellow green), and CD33+ non-monocytes (sky blue)

Marker of Interest Expression Using Nonconventional antibody
(red = highest expression tier, yellow = 2nd highest expression tier, light blue = 3rd highest expression tier, blue = 4th highest expression tier, and black = baseline or <)
Contact Celleqore today to analyze your flow cytometry data or develop a flow cytometry panel specific to your needs.